Hidden Resume Metrics by Job Role: Quantify Work That 'Can't Be Measured'
'Quantify your impact' is the rule everyone knows and no one teaches. Every guide shows a marketer who lifted ROAS 40% — for HR, Design, PM, Legal, Finance, Ops, CS, or Platform, that's no help. The PMTVQ 5-axis framework, three-step method for turning any accomplishment into an X-Y-Z impact bullet, five places to find numbers you thought were lost, defensible-estimate rules for when the number is truly gone, and a cheatsheet of typical metrics for eight 'hard-to-quantify' roles.
Published
Jul 27, 2026

"Quantify your impact" is the rule everyone knows and almost no one teaches. Every guide shows the same marketer who lifted ROAS 40% or the same engineer who cut latency 80%. For HR, Design, PM, Legal, Finance, Ops, CS, or Platform engineering, that guidance is useless — your actual daily work doesn't produce a headline metric on a Monday morning.
The 2026 reality is stricter than the guidance: at least two-thirds of your Experience bullets need real numbers. Any bullet ending in "improved", "responsible for", or "worked on" fails both the ATS 2.0 semantic filter and the recruiter's 7-second scan. This isn't a preference — it's what determines whether your resume surfaces in the shortlist or dies invisible in the parsed database.
This piece is the how. PMTVQ 5-axis framework for looking at any accomplishment from five angles, a 3-step method to convert one axis into an X-Y-Z impact bullet, five sources of hidden numbers you thought were lost, defensible-estimate rules for when the number is truly gone, and a cheatsheet of typical metrics for eight hard-to-quantify roles.
1. The 7-Second Scan · Bad vs Good
Two versions of the same underlying work, and what recruiters actually see in 7 seconds:
Bad:
"Improved team efficiency through workflow redesign."
Good:
"Cut ticket-handling time from 42 min to 11 min (-74%) across 6 agents by redesigning Zendesk triage macros."
The good version delivers three signals in one scan: metric + delta + mechanism. The bad version delivers zero and gets skipped. Multiply this difference across every bullet on a resume and the visibility gap becomes decisive.
The core rule: every impact bullet ends with a number (or a labeled estimate, covered below). Adjectives are noise; numbers are signal.
2. PMTVQ 5-Axis Framework · Any Work, at Least One Axis
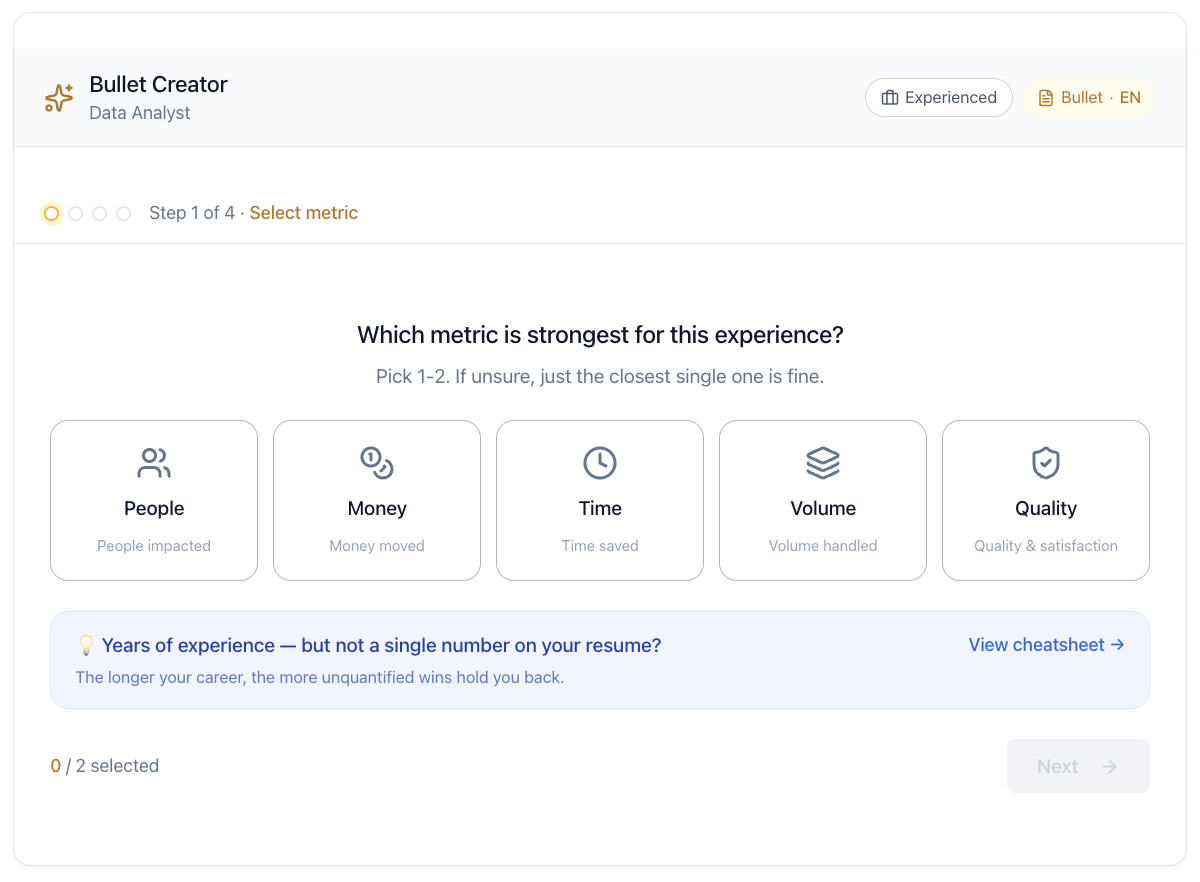
The trap for "hard-to-quantify" roles isn't that the work has no numbers — it's that you're only looking at it from one angle. PMTVQ says every accomplishment can be measured on at least one of five axes, and most surface numbers on two or three.
| Axis | The angle | Example bullet phrasing |
|---|---|---|
| People | How many people did the work reach or coordinate | "Trained 12 new hires" / "Coordinated 14-person cross-functional team" |
| Money | Budget owned, cost saved, revenue driven | "Managed $1.2M annual budget" / "~$180K infra savings YoY" |
| Time | Duration compressed, time-to-value shortened | "Cut turnaround 5 days → 1 day" / "Time-to-first-value 22 min → 6 min" |
| Volume | Throughput, counts, transaction volume | "Reviewed 220+ contracts/year" / "Processed ~10M records/day" |
| Quality | Accuracy, satisfaction, defect rate | "NPS 22 → 41" / "CSAT 94% across 1,400+ tickets/quarter" |
Rule of thumb:
- 1 axis = defensible (bullet has a number)
- 2 axes = strong (bullet has scale + change)
- 3 axes = complete (rare, save for headline bullets)
For any accomplishment, walk through all five. Ask "What number could describe this from a People angle? A Money angle?" etc. Most work surfaces numbers on 2-3 axes even when you initially thought it had none.
⚠️ Mask financials with ratios, multiples, or ranges — not raw revenue figures. "~$180K infra savings YoY" respects NDA; "$182,347 saved" violates most confidentiality clauses. Volume-only at Mid+ reads as filler; always pair with Quality or Time ("100 tickets/week" → "100 tickets/week at 94% CSAT").
3. The 3-Step Method · From Axis to X-Y-Z Bullet
Once you've picked an axis, three steps convert it into a resume-ready X-Y-Z impact bullet.
Step 1 · Pick 1-2 PMTVQ axes for this accomplishment
Not every axis works for every bullet. For a customer-facing workflow redesign, Time and Quality are usually strongest. For a hiring initiative, People and Time. Pick the axes where you have the strongest number to defend.
Step 2 · Before → After beats a single point
"NPS 52" alone can't be evaluated. Is that good? Compared to what?
"NPS 22 → 41" creates a 19-point delta the reader instantly grades as significant. Before/After pairs are 2-3× stronger than single-point metrics because they show the change you're responsible for, not just the endpoint.
Apply this to every axis:
- P: "Trained 12 new hires" → "Grew team from 6 to 18"
- M: "Managed $1.2M budget" → "Grew budget ownership $500K → $1.2M"
- T: "Cycle time 4 days" → "Cycle time 4 days → 1.5 days"
- V: "200 tickets/qtr" → "200 → 380 tickets/qtr with same headcount"
- Q: "NPS 41" → "NPS 22 → 41"
Step 3 · Ratio + Absolute together
Neither ratio alone nor absolute alone tells the full story:
- Ratio only: "-74%" → improvement is big but scale is unknown
- Absolute only: "$320K saved" → scale is known but not the % of the baseline
- Both together: "$320K saved (-42%)" → reader instantly gets both scale and delta
Combined, the three steps produce a bullet in the X-Y-Z format (Google's standard): "Accomplished [X] as measured by [Y] by doing [Z]."
Deep dive on X-Y-Z: Bullet Quantification 101.
4. Five Sources of Hidden Numbers
If a metric feels lost, it probably isn't. Most impact numbers survive somewhere in five places you can search in an afternoon:
- Slack / Teams / email search history — Search terms like "KPI", "launched", "shipped", "metric", "impact", "MRR", "ARR" against your outbox and channels. Weekly status updates and manager retros contain surprising numbers.
- Calendar audit — Regular 1:1s become "52 mentoring conversations/year". Vendor calls become "~40 vendor meetings in Q3." Repeated recurring events add up.
- Sent email folder — Weekly and monthly reports you wrote often contain the specific numbers you're trying to reconstruct. Search your outbox for the last 12 months.
- Product / analytics dashboards — Amplitude, Mixpanel, GA4, Datadog, Grafana, Salesforce reports. If it's still there, the number is exact. If access has been revoked, ask a former colleague for the read-only snapshot.
- Self-assessments · OKRs · performance docs — The richest source. Every annual review, quarterly OKR check-in, and self-assessment you filed likely quantified impact you've since forgotten.
A 90-minute audit across all five typically surfaces 3-8 numbers per major project.
5. Defensible Estimate · When the Number is Truly Gone
Sometimes the number is unrecoverable — access is gone, the system was deprecated, the OKR doc is on a former employer's server. Rather than skip the bullet or make up a precise-sounding figure, label the estimate honestly.
Format rules:
- Use "~" or "approximately", never both (redundant)
- Round to sensible precision ("~30%", not "~30.4%")
- Have a 2-3 sentence methodology ready in case an interviewer asks
Example:
"Estimated ~30% incident-load reduction, based on H2 vs H1 2024 on-call ticket volume."
Warning: making up a confident-sounding round number ("exactly 30%", "exactly $500K") without being able to explain the calculation is worse than an honest estimate. Labeled estimates pass; fabricated confidence fails at the interview.
The interviewer's follow-up will be "How did you arrive at that 30%?" You need to answer: "H1 2024 averaged ~14 pages/week; H2 averaged ~10. Not exact but the trend was clear from Datadog dashboards and the on-call rotation history." That's a defensible estimate. "Uh, that's just a rough sense…" is not.
6. Cheatsheet · Typical Metrics by Role
Eight roles that consistently feel "hard to quantify" — with the PMTVQ axes each role tends to land on, and one representative bullet each.
HR / People Ops
Typical axes: T · Q · V
- "Cut time-to-hire from 47 → 22 days across 9 engineering teams by rebuilding the sourcing → screen → onsite pipeline."
- Common metrics: time-to-hire, offer-accept rate, 90-day retention, source-of-hire quality, ramp time
- Estimate shortcuts: LinkedIn Recruiter counts, ATS pipeline exports, quarterly retention reports
Product Design
Typical axes: Q · V · M
- "Redesigned onboarding across 3 surfaces with 4 A/B tests over 2 sprints — D7 retention 22% → 31%."
- Common metrics: activation rate lift, task completion, error rate, A/B test count, D7/D30 retention
- Estimate shortcuts: Amplitude/Mixpanel funnels, UserTesting session counts, Figma version comments
Product Management
Typical axes: P · M · Q
- "Shipped 3 revenue proposals across 2 product lines · ~$7M budget owned · 2 of 3 launched within 12 months."
- Common metrics: features shipped, revenue attribution, activation/retention lift, cross-functional team size, decision cycles
- Estimate shortcuts: quarterly product reviews, roadmap doc history, Jira/Linear ticket velocity
Legal
Typical axes: V · T · M
- "Reviewed 220+ commercial contracts/year at 3-day average turnaround; flagged ~$7-figure aggregate liability risk across 12 vendor deals."
- Common metrics: contract volume, turnaround time, litigation avoided, risk value flagged, template reuse rate
- Estimate shortcuts: contract management system exports, legal ops dashboards
Finance / FP&A
Typical axes: T · Q · V
- "Built 8 Power BI reports feeding monthly close; compressed close 9 → 4 days, freeing ~120 hours/month of analyst time."
- Common metrics: close time reduction, forecast accuracy, budget variance, model accuracy, hours automated
- Estimate shortcuts: SAP/NetSuite audit logs, close calendar history, monthly analyst timesheets
Operations
Typical axes: V · T · Q
- "Reduced per-shipment cost -31% while maintaining SLA at 99.4% across 3 fulfillment centers over 14 months."
- Common metrics: SLA %, unit cost, throughput, error rate, on-time delivery, capacity utilization
- Estimate shortcuts: warehouse management system exports, carrier scorecards, monthly ops reviews
Customer Success · Support
Typical axes: Q · T · V
- "Handled 1,400+ tickets/quarter at 94% CSAT and 78% FCR; ramped 6 new agents to full quota in 8 weeks."
- Common metrics: CSAT, NPS, FCR (first-contact resolution), TTR (time-to-resolution), ramp time, churn saves
- Estimate shortcuts: Zendesk/Intercom analytics, quarterly CS reports, NPS surveys
DevOps · Platform Engineering
Typical axes: T · Q · M
- "Cut deploy time 45 → 6 min and failure rate 18% → 4% while reducing idle-infra spend ~30% YoY across 12 services."
- Common metrics: deploy frequency, deploy failure rate, MTTR, infra cost, uptime, incidents/quarter
- Estimate shortcuts: Datadog/Grafana dashboards, CI/CD system logs, cloud provider billing history
7. Team Work · Extracting Your Slice
Common blocker: "The metric is a team outcome, not mine specifically." True for most senior work, but you can still slice out your contribution.
Format: team-level metric + your specific role/scope.
"Co-led a 7-person team that delivered ~$7-figure ARR uplift · owned GTM strategy and 4 of 12 sprint milestones end-to-end."
The team result gives scale; your slice gives specific accountability. Both are needed — team-only reads as riding coattails, slice-only reads as small.
The 4D lens for team → individual: Decision · Design · Document · Drive. For a shared outcome, at least one of these was uniquely yours. That's the axis for your bullet. In interview STAR answers, expand it: bullet = Result, 4D = Action.
The clarifying question: "Would the company have run identically if I hadn't done this?" Every honest "no" is a PMTVQ metric waiting to be phrased.
8. Automating the Repetitive Work
The four Bullets tools operationalize hidden-metric discovery into a repeatable workflow. Start with Bullet Creator — three steps:
1 · Select 1-2 PMTVQ axes for the accomplishment. The tool asks you which axes match — you don't need to guess the framework.
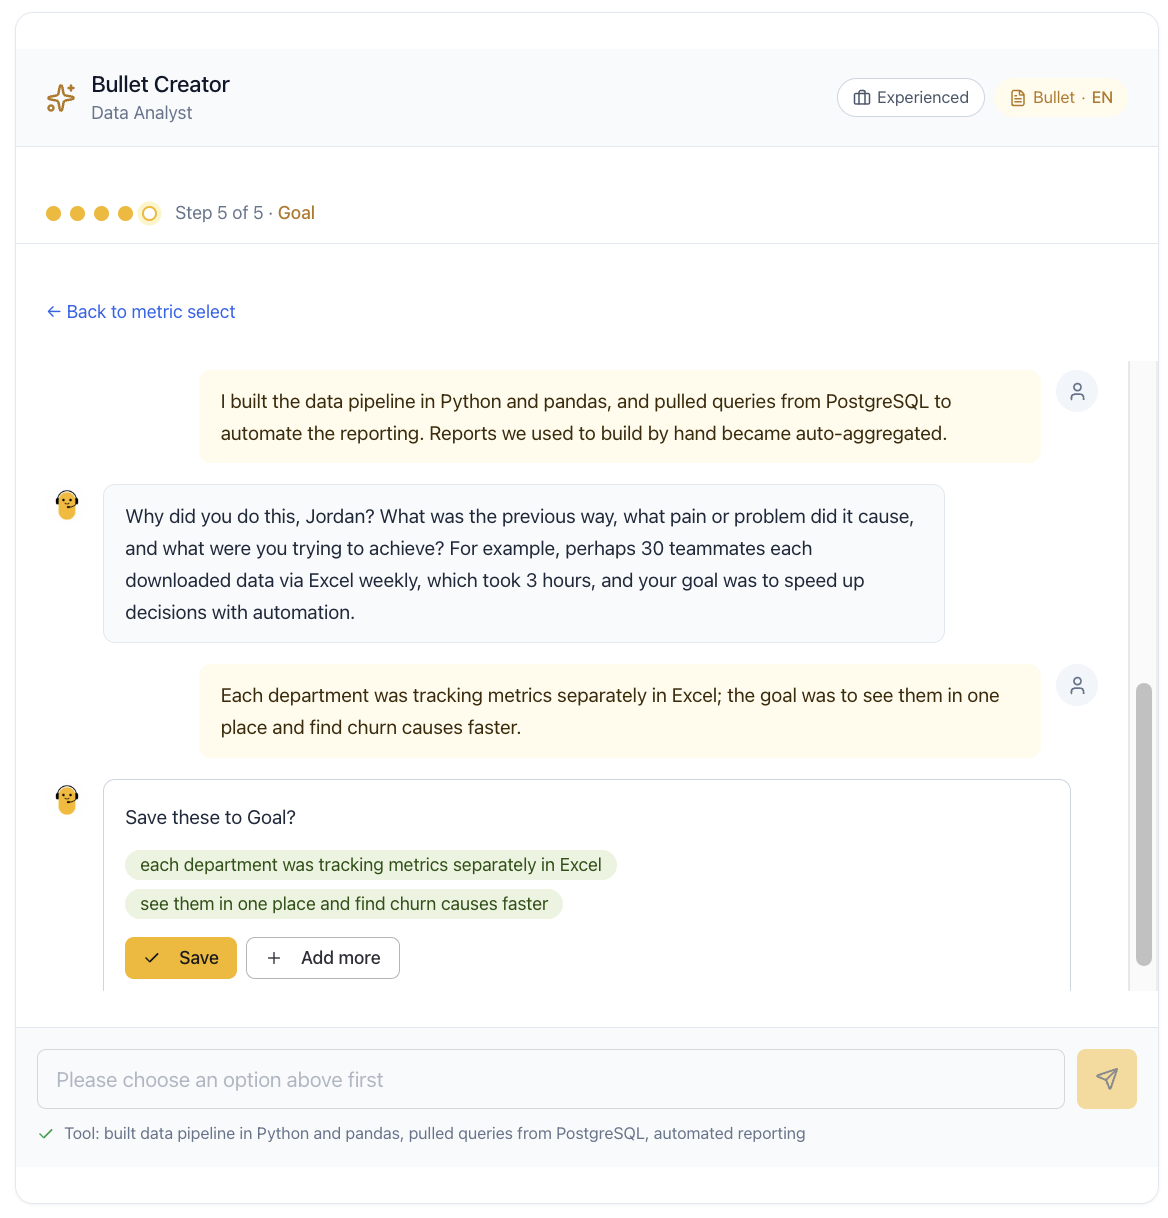
2 · AI Interview surfaces the specific numbers, tools, and context by asking you conversational questions. Your figures are preserved verbatim; nothing is fabricated.
3 · X-Y-Z impact bullet follows Google's format (Accomplished [X] as measured by [Y], by doing [Z]).
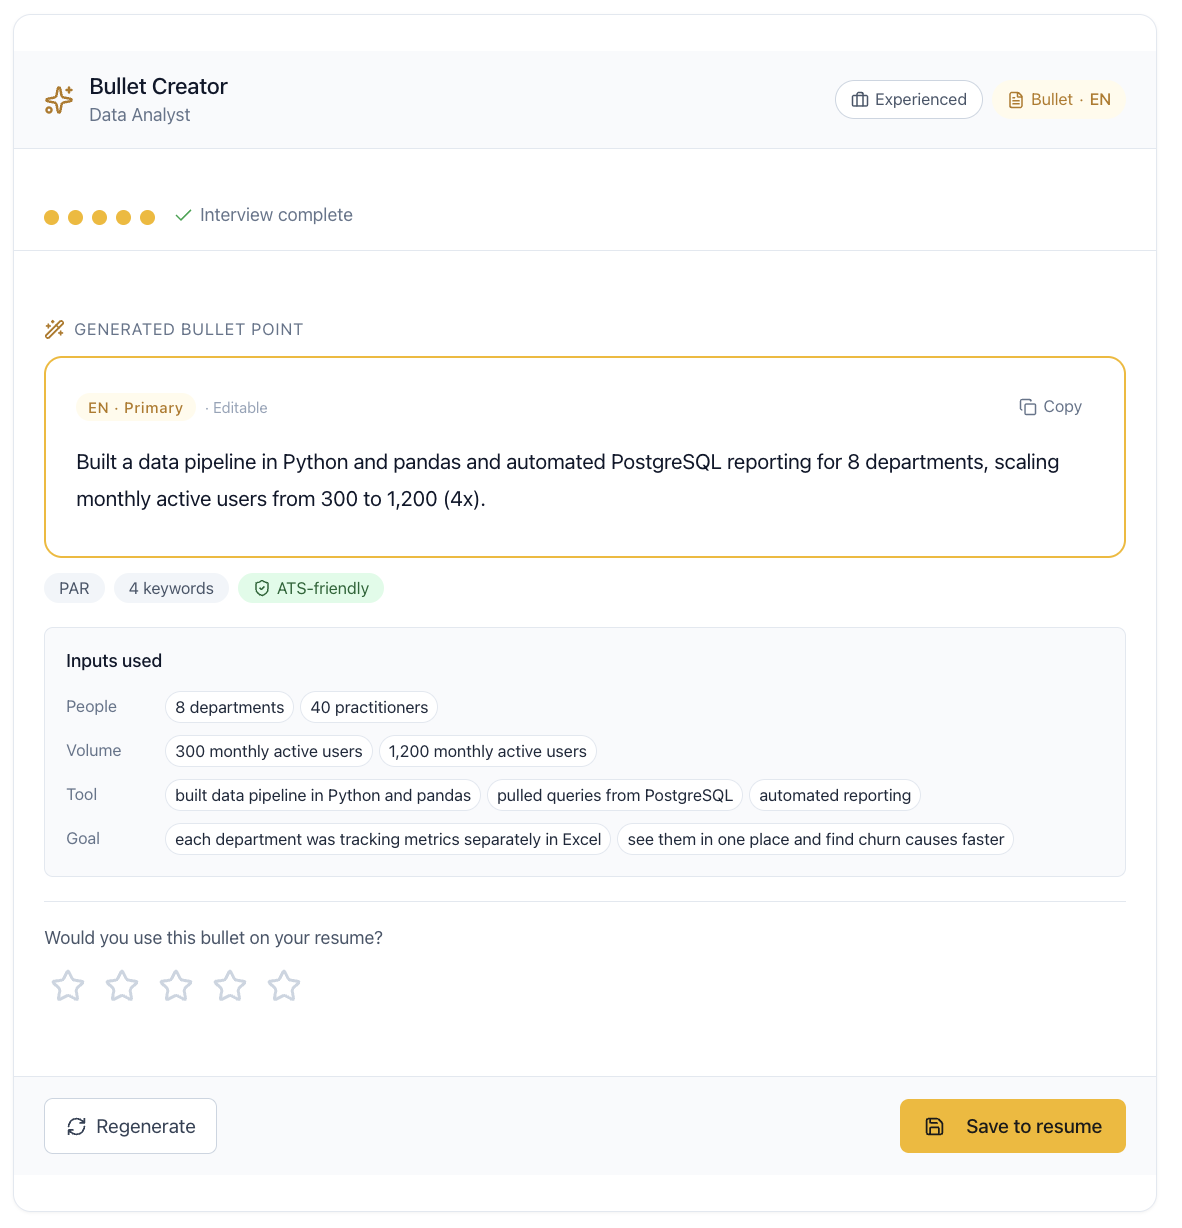
Data Analyst example (P + V): "Built Python + pandas pipeline automating PostgreSQL reporting across 8 departments, scaling MAU coverage 300 → 1,200 (4×) over 6 months."
Once the master library exists, the other three tools handle per-application work:
- JD Clipper (Chrome extension) — Save any LinkedIn / Indeed / Greenhouse / Lever posting; ATS-optimized keywords extracted automatically by weight.
- Resume Generator — Matches saved postings against your master bullet library; assembles company-tailored resume as X-Y-Z impact bullets, configuring bullet count per experience block per company.
- Cover Letter Generator — Drops in company URL; scanner reads six categories of company signal and drafts an achievement-led 4-part narrative (result → context → action → value, 15/20/50/15%) drawing from the same master bullets.
Start with Bullet Creator → — one PMTVQ axis, one defensible bullet, numbers verbatim. Fifteen minutes per accomplishment.
Where this fits
Foundational: What is ATS in 2026 · ATS 7 Rules 2026. Related: Bullet Quantification 101 · Entry-Level Resume · Senior IC Triple-Artifact Workflow.
Sources: Ladders 2018 eye-tracking research (7-second recruiter scan), Bullets Editorial PMTVQ framework, industry practitioner surveys on defensible-estimate norms across HR, Design, PM, Legal, Finance, Ops, CS, and DevOps.
Tagged with
Comments
0 comments
No comments yet. Be the first to comment!
Ready to build your resume?
Bullets — Tailored resumes and cover letters, faster.